Tunisian Sign Language Recognition System of Static Two-Handed Asymmetrical Signs using Deep Transfer Learning
Research article  Open access |
Available online on: 04 December, 2024 |
Last update: 10 December, 2024
Abstract-
Deaf and Hard of Hearing people use Sign Languages in the interaction among themselves and among hearing people. The automatic recognition of Static Two-Handed Asymmetrical signs is a hard operation, since it involves the implementation of complex processing system for providing image perception. In this paper, we produce a dataset of 2000 images containing 12 Two-handed Asymmetrical Tunisian Signs and utilize transfer learning for automatic recognition, achieving 98.29 % Accuracy. The simulations prove that this best Accuracy value is yielded by the Xception model when combined with the Adagrad optimizer, which indicates that our approach achieves high results despite using a small Dataset.
Keywords- TnSL, Transfer Learning, Two-Handed Asymmetrical Signs.
Introduction
According to the World Health Organization (WHO), the number of people with hearing loss has risen to 466 million, or 6 % of the world’s population. They face significant communication barriers, particularly in healthcare, education, workforce, and transportation. Sign Language (SL) is their only way of expression and exchange. However, in many cases, deaf persons require the permanent availability of interpreters who act as communication bridge to deal with speech-able and hearing society [1].
This process is not usually workable and requires a high budget, especially in the developing countries and the underlying zones which face a severe shortage problem of interpreting services due to lack of training for Sign Language interpreters. Because of the significant population of Deaf people, researchers around the world have been working to mitigate this communication gap by setting up the automated Sign Language Recognition framework [2].
Basically, the Sign Words are classified into three parts as follows: 1) One-handed Signs that use one hand. 2) Two-handed Symmetrical Signs in which the motions and the handshapes of the two hands are identical. 3) Two-handed Asymmetrical Signs that are performed by moving the leading hand and letting the other subordinate hand operate as a base [3]. The hand gestures can be categorized as either Static or Dynamic. There has been a lot of research on Sign Language recognition on both Static and Dynamic gestures to interpret different languages such as American SL, Indian SL and Chinese SL. However, as we dive deep into the recognition of Static Signs, we find that authors have been dealing with alphabets and numbers with are conveyed through One-handed Signs [4]. They have not coped extensively with Static Two-handed Asymmetrical Sign Words. The automatic recognition of these gestures has been a challenging task due to the high complexity of image perception. Asymmetry adds complexity since the model needs to account for different shapes of each hand.
Tunisian Sign Language (TnSL) seems to be the official national language for deaf and hard-of-hearing citizens in Tunisia [5], with a substantial difference from other Sign Languages. In this context, we implement a novel Deep Convolutional Neural Network (CNN) that can correctly recognize Static TnSL Sign Word belonging to the Two-handed Asymmetrical category. Specifically, our framework leverages Transfer Learning (TL) tools by fine-tuning state-of-the-art network models pre-trained on the ImageNet database because TL [6] can successfully deal with data scarcity and enhance sign identification performance. Through our experiments, we aim at finding the best model architecture that can adapt to our small-sized TnSL Dataset of 2000 images and can efficiently cope with the Two-handed Signs.
Literature Review
The majority of Sign Language Classification solutions mentioned in the literature [7] adapt to large-scale Datasets and are not stable when being trained on small-sized Datasets. The cost involved in collecting images and creating any large Dataset is immense and requires a large logistical effort. Hence, small Datasets raise the question of whether Deep Learning is applicable for environments with scarce data. In fact, it is rare, though more and more challenging, for Datasets with small sizes to take advantage of Deep Learning because of over-fitting problem that happens when implementing (CNN) models. Hence, we refer to several works which have dealt with Sign Language classification under small Datasets.
The work in [8] applies a vision-based system for the translation of Arabic alphabets into spoken words with a Dataset of 3875 images. To facilitate better generalization of the model on unseen data, the authors integrate data augmentation in the training process. These practices achieve an Accuracy of 90 %, which ensures that this system demonstrates itself to be highly reliable and efficient. Despite these good results under the small Dataset, the approach focuses only on One-handed Signs.
Authors in [9] implement a CNN recognition system for the interpretation of British (BSL) Alphabets under a dataset of around 10000 images, having 19 classes. Among these Signs, there are 12 Two-handed Asymmetrical Signs. Before the training, the images go through these filtering steps: removing background, conversion to grayscale and application of Gaussian blur filter to keep the main hand features. Although the work has focused on the Two-handed gestures, its Accuracy rate it below 90 % and does not achieve acceptable results.
A paper on Bengali Sign Language Recognition system using VGG-v16 pre-trained network for the classification of 37 letters of Bengali alphabets under a Dataset of 1147 images is published in [10]. These Bengali letters are conveyed through Two-handed Asymmetrical Signs. However, the model obtains a Validation Accuracy less than 90 %, demonstrating that it requires more enhancements to adapt to complex features.
Another study in [11] presents a deep CNN based classifier that recognizes both the images of letters and digits in American SL using a Dataset of 2515 images. To overcome data scarcity and over-fitting problem, the model integrates the data augmentation techniques in the Train Dataset. According to the simulation results, the approach achieves good performance with a Validation Accuracy of 94.34 % under the small-sized Dataset. Nevertheless, all the implicated Signs are One-handed.
Based on these observations, we notice that most of implicated models have focused on single-handed signs and have not dealt effectively with the Two-handed Asymmetrical Signs. As we are aware that the Two-handed Asymmetrical Signs dominate most of the Sign Languages, we construct a Tunisian Language (TnSL) Dataset with 12 classes of TnSL Sign Words, all are expressed through Two-handed motions. To find the best model for TnSL static gesture recognition, our approach leverages Transfer Learning tools by fine-tuning some popular state-of-the-art network architectures pre-trained on the ImageNet Dataset and [12] by testing the commonly used optimizers. Therefore, this comparative study gives insights into implementing the right CNN model for our static TnSL recognition.

Figure 1. Tunisian Sign Words
Proposed Methodology
- Data Preprocessing
Prior to the training phase, it is compulsory to go through data preparation process to make our TnSL Dataset in harmony with the models as an input.
- Data Collection
We attempt to build a Dataset for Tunisian SL, having 12 classes of Two-handed Asymmetrical Sign Words. The classes of TnSL Words are: ‘Coffee’, ‘Tea’, ‘Election’, ‘Law’, ‘Help’, ‘Dance’, ‘Association’, ‘Prison’, ‘Psychology’, ‘Ministry’, ‘Municipality’ and ‘Government’. In fact, we capture the Static gestures of images from a web camera under different illuminations and controlled background using the OpenCV image processing module. Totally, there are 2000 images where each category has more than 160 images, and all are in RGB format with high resolution and readjusted to a size of (224*224) pixels.
- Data Reorganization
Because the number of images per classes differs, the imbalance between classes could destabilize the training process. Therefore, there must be an equal number of images among all the 12 classes to mitigate this disparity. At each iteration, the script randomly picks 54 images from each folder, shuffles them and removes the rest. As there are 3 iterations in the process, the final Dataset consequently has 1944 images, and each folder contains 162 samples. Figure.1 displays some samples within the TnSL Dataset.
- Data Splitting
Our TnSL Dataset is further divided into Train, Validation and Test sets of 80%, 10% and 10% respectively. This operation makes our Dataset more robust as the training will be done on the split ratio of the Train and Validation data.
- Data Augmentation
Finally, we perform data augmentation on the Train set. With increased Train set size and a more diverse sequence of images, the process can create more generalized and skillful models and avoid over-fitting problem. The applied configurations include: brightness range [0.5 -1.2], zooming range [1.0, 1.2], rotation range [-10°, +10°], vertical shifting range with 10% and horizontal shifting with 10%. Then, all images in the dataset are normalized by re-scaling these pixel values into a new range of (0,1).
- Transfer Learning
Transfer Learning is a field of Deep Learning that reuses a previously trained model on large Dataset and applying it to another situation generally with small Dataset with the intention of attaining higher accuracy. Here are the pre-trained models to be tested in our case:
- InceptionV3
InceptionV3 [13] is a popular Transfer Learning model that was released in the year of 2015 and comes from Inception family of CNN architecture. Being well-suited for situations having constraints on computing resources, this model excels in operations such as object detection and image classification. InceptionV3 comprises of 48 layers and brings improvements to its predecessors, including the integration of label smoothing and (7× 7) convolutions.
- Xception
Xception [13] is a CNN that was launched by Google researchers. The Xception system is inspired from the Inception architecture, whereby the Inception is replaced by the Depth-wise Separate Convolution Layers. The solution accelerates the convergence process and achieves significantly higher Accuracy as compared to the Inception models when trained under ImageNet Dataset.
- VGG-v16
Being the most used Transfer Learning algorithm in image classification tasks [13], VGG was launched by Visual Geometry Group Lab of Oxford University. It is huge by today’s standards thanks to the flexibility and simplicity of its architecture. With only 16 layers in which the 13 convolution layers are stacked with (3×3) filters, the VGG-v16 makes the network easy to manage and achieves strong performance.
- VGG-v19
Being an extension of the VGG-v16 model [13], VGG-v19 contains 19 layers instead of 16. It has the same structure as VGG-v16, with additional Convolutional and Max-pooling layers. The VGG-v19 is slightly more accurate than VGG-v16 on the ImageNet Dataset due to its additional layers.
- MobileNetV2
As its name mentions, MobileNetV2 is designed for mobile applications [13], and it is TensorFlow’s first mobile computer vision model. What makes MobileNetV2 special is that it requires very less computation power to run and exhibits less execution time as compared to other exiting backbones.
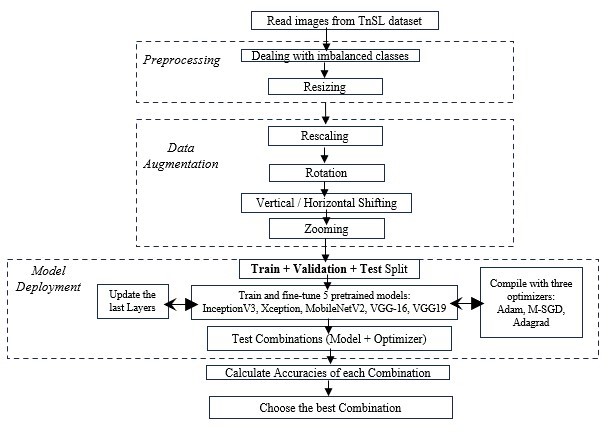
Figure 2. Proposed workflow for the TnSL recognition
- Fine-tuning of the pre-trained models
We fine-tune the models listed above and retrain each of them on our TnSL Dataset by freezing the first layers and replacing the last and Fully Connected layers. Here are the main modifications that we integrate:
- Input Layer
Before initializing the training process, the images are resized to the shape of (224,224,3), so that the ImageDataGenerator class can feed them to the network.
- Addition of a Block
For each model, we remove some Fully Connected (FC) layers from each of the candidate backbone network to fit our Dataset and add a new block of 4 layers at the bottom of the ready-made architecture. The insertion of such a block makes our model more constructive and appropriate for execution following the complexity and the format of our TnSL Dataset. Specifically, the block of four additional layers comprises of: GlobalAveragePooling2D Layer, FC1 of 1024 units and with “Tanh” as Activation Function (AF), FC2 of 1024 units and with “Tanh” as AF and FC3 of 512 units and with “Tanh” as AF. Replacing the commonly used “Relu” function in the (FC) Layers by the “Hyperbolic Tangent” function “Tanh” enhances the training process of the models and makes it faster without affecting the overall performance. The “Tanh” function can be expressed in the following Equation.1:
- Output Layer
This last Layer OL is adjusted with relevance to the number of classes that should be set to 12. The Output Layer calls the Function “Softmax” to differentiate between the gestures.
- Optimizers
An optimizer is a mandatory argument required to compile the model before the training operation. With the same reasoning as above, we opt for the commonly used methods in the literature that are Mini-batch Gradient Descent (M-SGD), Adam and Adagrad to train each of the five listed models and will select the best one that suits our case. Figure.2 resumes the overall Flowchart of our proposed approach.
Experiments and Assessments
- Experiment Set-up
The experiments are carried out under Google Colaboratory platform where we use these fundamental frameworks: Keras, TensorFlow, Numpy and Matplotlib, etc. During this simulation phase, we present three scenarios depending on the optimizer type: Scenario1, Scenario2 and Scenario3 corresponding respectively to M-SGD, Adam and Adagrad.
Throughout each set of training, we select the same value of hyper parameters. We choose the batch value of 64 to pump 64 image samples at each iteration of the training process, after evaluating the scenarios with different batch sizes: 32, 64 and 128. As for the Learning Rate, we opt for the value of 0.0001. Then, we add Early Stopping with Patience of 8 after trying different values (4, 5 and 8) to prevent over-fitting. We use some assessment metrics (Accuracy, Recall, F1-Score, Precision and Confusion Matrix) to measure the performance of the proposed models and visualize the effect of each combination of parameters (pre-trained model, optimizer) before taking the final decision
- Model Evaluation
Through our experiments conducted in this section, we aim at tuning the network with the highest Test Accuracy that measures the model’s generalization on unseen data. This is performed in two steps, first with the visualization of the effect of the three optimizers on the different models, second by analyzing the various executions generated by the five pre-trained network architectures.
- Setting of Transfer Learning Comparison
We refer to the Accuracy and Loss metrics to view which optimizer seems to perform best on the Validation Dataset. Obviously, in Fig.3(b) and Fig.3(e), the runs with the Adam optimizer generate significantly bad performances for all the included pre-trained models. The fluctuations throughout the Epochs demonstrate that Adam has difficulties in converging toward a good classification solution and makes different choices at different points in the learning process. This is a sign of over-fitting which occurs when the model performs poorly on the unseen data.
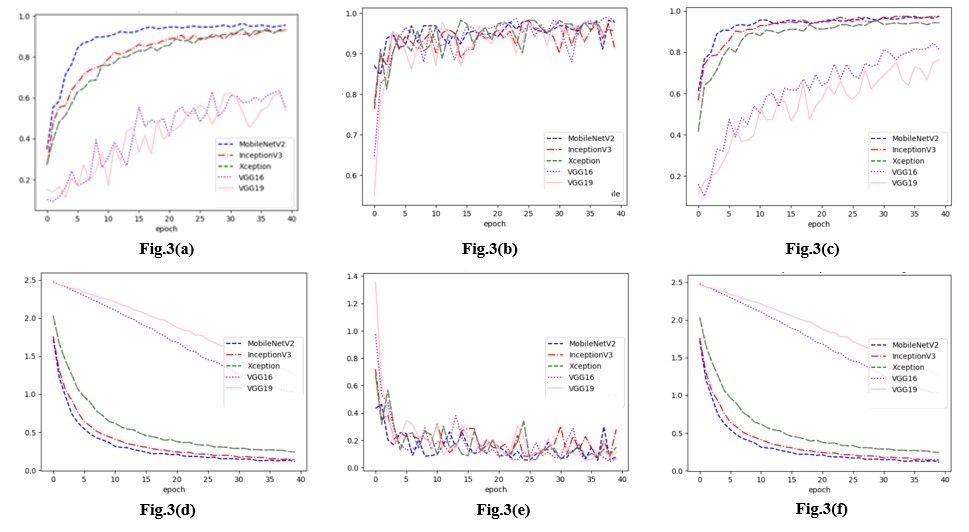
Figure 3. (3.a) Validation Accuracy using M-SGD, (3.b) Validation Accuracy using Adam, (3.c) Validation Accuracy using Adagrad, (3.d) Validation Loss using M-SGD, (3.e) Validation Loss using Adam, (3.f) Validation Loss using Adagrad)
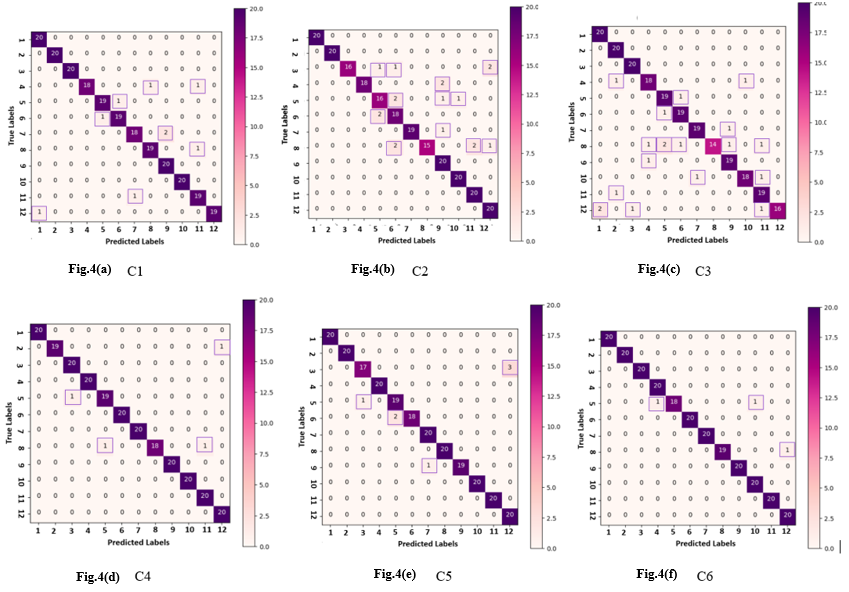
Figure 4. Confusion Matrix of C1, C2, C3, C4, C5 and C6
On the other hand, the classification seems to go on better with the M-SGD and Adagrad optimizers because we notice continuity in the right direction on both Accuracy and Loss curves. However, the VGG-v16 and VGG-v19 produce considerably lower results than the remaining models and under both the M-SGD and Adagrad cases. Their Loss curves do not move in the right direction and generate high values. This problem is due to under-fitting which happens when reality is just more complex than the model. The VGG-v16 and VGG-v19 are far away from learning the underlying structure of data, so we eliminate the Adam optimizer and the two models VGG-v16 and VGG-v19 from our future analysis.
Consequently, we consider only the three models: MobileNetV2, InceptionV3 and Xception and the two optimizers M-SGD and Adagrad for our upcoming tests until we select the best solution among the six combinations. For simplicity, they are referred to as C1, C2, C3, C4, C5 and C6 to correspond respectively to: (MobileNetV2 + M-SGD), (InceptionV3 + M-SGD), (Xception + M-SGD), (MobileNetV2 + Adagrad), (InceptionV3 + Adagrad) and (Xception + Adagrad).
- Confusion Matrix
We use Confusion Matrix to analyze the contribution of Transfer Learning combinations listed above (C1, C2, C3, C4, C5 and C6) in the recognition of the 12 TnSL Sign Words. Confusion Matrix demonstrates to what extent each of these six configurations successes in classifying the 12 Signs. As each Word has its own features, one configuration can perform better than others in identifying the number of these Signs whereas another one adapts better for other Signs. We evaluate the different models using fundamental measures such as Precision, Recall and F1-Score as depicted in Table.1. In Confusion Matrix, these 12 Words: ’Jail’, ’Coffee’, ’Law’, ’Municipality’, ’Election’, ’Tea’, ’Association’, ’Dance’, ’Help’, ’Government’, ’Ministry’ and ’Psychology’ are referred respectively by numbers from 1 to 12. The aptitude of a certain classifier to find all correct predictions is indicated by the Recall metric.
Table 1: Performance metrics of all the Combinations on the Test Set
| Class | Jail | Coffee | Law | Municipality | Election | Tea | Association | Dance | Help | Governorate | Ministry | Psychology | Model |
| Pre
Re F1 |
0.95
1 0.98 |
1 1 1 | 1 1 1 | 1
0.90 0.95 |
0.95
0.95 0.95 |
0.95
0.95 0.95 |
0.95
0.90 0.92 |
0.95
0.95 0.95 |
0.91
1 0.95 |
1 1 1 | 0.90
0.95 0.93 |
1
0.95 0.97 |
C1 |
| Pre
Re F1 |
1 1 1 | 1 1 1 | 1
0.80 0.89 |
1
0.90 0.95 |
0.84
0.80 0.82 |
0.78
0.90 0.84 |
1
0.95 0.97 |
1
0.75 0.86 |
0.83
1 0.91 |
0.95
1 0.98 |
0.91
1 0.95 |
0.87
1 0.93 |
C2 |
| Pre
Re F1 |
0.91
1 0.95 |
0.91
1 0.95 |
0.95
1 0.98 |
0.90
0.90 0.90 |
0.86
0.95 0.90 |
0.90
0.95 0.93 |
0.95
0.95 0.95 |
1
0.70 0.82 |
0.90
0.95 0.93 |
0.95
0.90 0.92 |
0.86
0.95 0.90 |
1
0.80 0.89 |
C3 |
| Pre
Re F1 |
1 1 1 | 1
0.95 0.97 |
0.95
1 0.98 |
1 1 1 | 0.95
0.95 0.95 |
1 1 1 | 1 1 1 | 1
0.90 0.95 |
1 1 1 | 1 1 1 | 0.95
1 0.98 |
0.95
1 0.98 |
C4 |
| Pre
Re F1 |
1 1 1 | 1 1 1 | 0.94
0.85 0.89 |
1 1 1 | 0.90
0.95 0.93 |
1
0.90 0.95 |
0.95
1 0.98 |
1 1 1 | 1
0.95 0.97 |
1 1 1 | 1 1 1 | 0.87
1 0.93 |
C5 |
| Pre
Re F1 |
1 1 1 | 1 1 1 | 1 1 1 | 0.95
1 0.98 |
1
0.90 0.95 |
1 1 1 | 1 1 1 | 1
0.95 0.97 |
1 1 1 | 0.95
1 0.98 |
1 1 1 | 0.95
1 0.98 |
C6 |
According to Table.1, the schemes trained under the M-SGD optimizer, which are C1, C2 and C3, yield more classification errors than those configured with the Adagrad optimizer. The total number of misclassifications caused by C1, C2, C3, C4, C5 and C6 are respectively 9, 21, 24, 4, 7 and 3. Evidently, the combinations C3 (Xception + M-SGD) and C2 (InceptionV3 + M-SGD) yield the worst performances as compared to the other combinations, especially for the sign ’Dance’ whose Recall value drops to less than 0.75. Meanwhile, we notice serious degradation for the signs ’Law’, ’Municipality’, ’Election’ and ’Tea’ regarding feature extraction based on C2. The same problem persists under the training of C3 (Xception + M-SGD) that results in a lot of incorrect predictions for the Signs ’Municipality’, ’Government’ and ’Psychology’. Their corresponding Recall values are below 0.95. According to Fig.3(a), the combination C1 (MobileNetV2 + M-SGD) has difficulties in classifying the two Signs ’Municipality’ and ’Association’ whose Recall value is 0.90.
Concerning the combination C4 (MobileNetV2 + Adagrad), it performs well for all classes, except for the class ’Dance’ that the model mistakes two times as proved in Fig.3(d). Moreover, the combination C5 (InceptionV3 + Adagrad) ‘s results are close to those obtained by C4 in terms of total misclassifications. Even though C4 exhibits good performances in Fig.3(e), the model presents two incorrect predictions for the Sign ’Tea’ and three incorrect predictions for Sign ’Law’. Their Recall values are 0.90 and 0.85 respectively. The combination C6 seems to operate the most efficiently as it has the least number of false predictions. However, the Sign ’Election’ is not well classified under C6. Having complicated features, the Word ’Election’ is better recognized by C1,C3,C4 and C5.
Based on the above reasoning, we decide to exclude the combination C2 and C3 and keep the C1, C4, C5 and C6 for designing our upcoming network architecture. To validate our choice, we refer to Figure.5 which illustrates the Test Accuracy values of each combination. C1, C4, C5 and C6 present similar values of Test Accuracy (95.8%, 96.60%, 97.5% and 98.2% respectively) with a slight difference among them, whereas C2 and C3 having 91.67% and 90.42% as Test Accuracy values respectively are far away from the mean value. Since we have to pick one solution from the four chosen combinations, we discuss in the next section which model and which optimizer fit better for the given case.
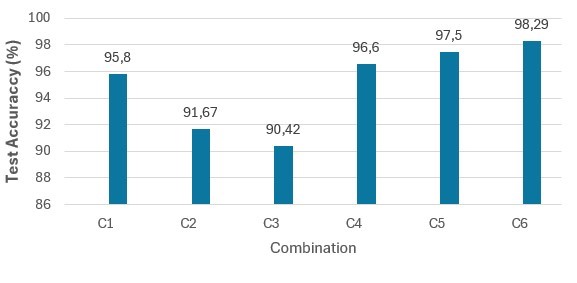
Figure 5. Test Accuracy of C1, C2, C3, C4, C5 and C6
- Model Selection
Since there is not huge difference in terms of Accuracy and incorrect predictions between the 4 combinations we discussed above, we need other statistical visualizations to show which one is the most eligible for the TnSL classification. In this context, a box and whisker plot visualizes the distribution of Test Accuracy scores for each combination. With reference to box plot in Figure.6, we see that the spread of Test Accuracy scores tightens considerably under the training of C6 (Xception + Adagrad). Although C5 (InceptionV2 + Adagrad) exhibits slightly close number of misclassifications and Accuracy value as C1 (MobileNetV2 + M-SGD), it has a large variance in the results.
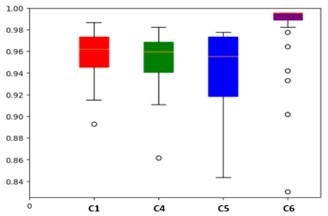
Figure 6: Box plot of Test Accuracy of C1, C4, C5 and C6
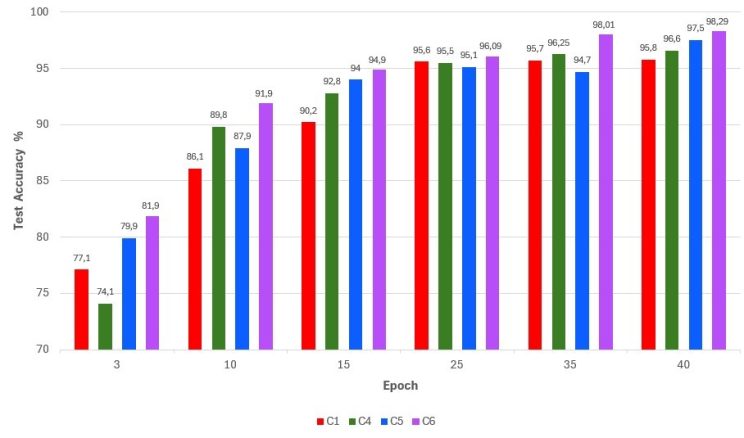
Figure 7: Differences in Test Accuracy between C1, C4, C5 and C6 across the Epochs
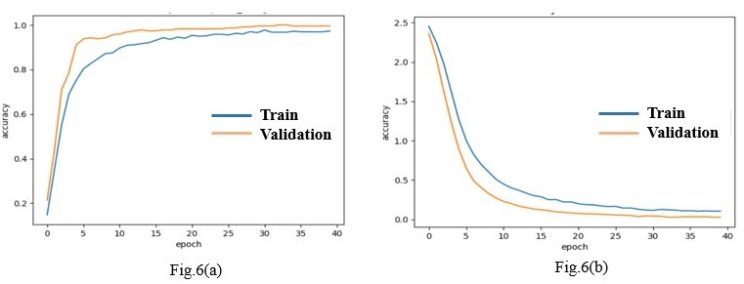
Figure 8. Train/Validation Accuracy & Train/Validation Loss Curves of Xception
The InceptionV3 model presents a high rate of perturbations and instability in recognizing new data from the Test set, so it cannot learn the problem reasonably well. C6 generates lower spread range than C1 and C4, despite some irrelevant outliers in its vertical line. These latter are not numerous to be taken into consideration in the evaluation process. Also, in Figure.7, the bar chart which displays the Test Accuracy of each Combination at different Epoch values (3, 10, 15, 35, 40) demonstrates that C6 stays ahead of the remaining Combinations (C1, C4 and C5) at every iteration of training. Hence, the generated simulations displayed in Figure.6 and Figure.7 prove that the Xception model performs better than the other models when being combined with the Adagrad optimizer as it obtains the best Accuracy rate of about 98.29 %.
Table2: The six running steps to measure the performance of C6 (Xception + Adagrad) for classification of TnSL Signs
| Run N ° | 1 | 2 | 3 | 4 | 5 | 6 |
| Accuracy (%) | 98.295 | 98.281 | 98.287 | 98.291 | 98.304 | 98.286 |
To prove this value does not come from the effect of random weights, we repeat the training process six times and gather the related measures of each running step in Table.2. Obviously, we notice some short of convergence in the obtained values, which demonstrates the stability of the combination C6 during the prediction process. Meanwhile, Figure.8 in which are depicted both Accuracy and Loss curves related to Train and Validation sets proves the efficiency of such model (Xception + Adagrad).
However, this model has difficulties interpreting the Sign “Election” according to the Confusion Matrix in Figure.4(f). The class “Election” is confused with the classes “Municipality” and “Government”. This could the result of online data augmentation techniques applied during the training process, leading to the similarities in the abstract representations and features learnt by the CNN network.
Conclusion
This study demonstrates the potential of using Transfer Learning for TnSL recognition. Our method is applied to Tunisian Sign Language (TnSL) Dataset of 2000 images, equipped with data augmentation technique. The Xception model yields the best Test Accuracy value of 98.29 % when combined with the Adagrad optimizer for the recognition of Static Two-handed Asymmetrical Signs under the small-sized Dataset. This research is the fundamental step toward developing the Tunisian Sign Language TnSL recognition system that can serve the Tunisian deaf community in day-to day situations and alleviate the communication barrier.
Future work will focus on expanding the Dataset and developing systems for dynamic sign recognition. The Dataset needs to be further expanded to include more TnSL signs and allow dynamic interpretations of sentences.
References
[1] Othman, A., Dhouib, A., Chalghoumi, H., Elghoul, O., and Al-Mutawaa, A. (2024). The acceptance of culturally adapted signing avatars among deaf and hard-of-hearing individuals. IEEE Access.
[2] Rastgoo, R., Kiani, K., and Escalera, S. (2021). Sign language recognition: A deep survey. Expert Systems with Applications, 164:113794.
[3] Töngi, R. (2021). Application of transfer learning to sign language recognition using an inflated 3d deep convolutional neural network. arXiv preprint arXiv:2103.05111.
[4] Schmalz, V. J. (2022). Real-time Italian sign language recognition with deep learning. In CEUR Workshop Proceedings.
[5] Nefaa, A. (2023). Genetic relatedness of Tunisian sign language and french sign language. Frontiers in Communication.
[6] Hosna, A., Merry, E., Gyalmo, J., Alom, Z., Aung, Z., and Azim, M. A. (2022). Transfer learning: a friendly introduction. Journal of Big Data.
[7] Chavan, A., Bane, J., Chokshi, V., and Ambawade, D. (2022). Indian sign language recognition using Mobilenet. In 2022 IEEE Conference on Interdisciplinary Approaches in Technology and Management for Social Innovation (IATMSI).
[8] Zakariah, M., Alotaibi, Y. A., Koundal, D., Guo, Y., and Mamun Elahi, M. (2022). Sign language recognition for arabic alphabets using transfer learning technique. Computational Intelligence and Neuroscience, 2022(1):4567989.
[9] Buckley, N., Sherrett, L., and Secco, E. L. (2021). A CNN sign language recognition system with single & double-handed gestures. In 2021 IEEE 45th Annual Computers, Software, and Applications Conference (COMPSAC), pages 1250–1253. IEEE.
[10] Hossen, M., Govindaiah, A., Sultana, S., and Bhuiyan, A. (2018). Bengali sign language recognition using deep convolutional neural network. In 2018 joint 7th international conference on informatics, electronics & vision (iciev) and 2018 2nd international conference on imaging, vision & pattern recognition (icIVPR).
[11] Das, P., Ahmed, T., and Ali, M. F. (2020). Static hand gesture recognition for American sign language using deep convolutional neural network. In 2020 IEEE region 10 symposium (TENSYMP), pages 1762–1765. IEEE.
[12] Deng, J., Dong, W., Socher, R., Li, L.-J., Li, K., and Fei-Fei, L. (2009). Imagenet: A large-scale hierarchical image database. In 2009 IEEE conference on computer vision and pattern recognition, pages 248–255.
[13] Plested, J. and Gedeon, T. (2022). Deep transfer learning for image classification: a survey. arXiv preprint arXiv:2205.09904.
