Too Many Tabs Open? Using Everyday Computer Data to Support Focus for adults with ADHD
Research article  Open access |
Available online on: 16 September, 2025 |
Last update: 16 September, 2025
Open access |
Available online on: 16 September, 2025 |
Last update: 16 September, 2025
Abstract –
Adults with ADHD often struggle to maintain focus in digital environments, where multiple tabs and applications compete for attention. Although attention can be measured in clinical settings, there is a need for practical tools that operate in everyday contexts. This proof-of-concept study investigates whether simple patterns of computer use—such as tab switching frequency, idle time, and relevance of activity to the intended task—can be used to estimate attention in real time. A machine learning model trained on these features achieved a cross-validated R² of 0.77 within a small, simulated dataset—suggesting potential for this approach in predicting moment-to-moment attention. This approach has potential to inform more adaptive, accessible tools to support focus and self-regulation for adults with ADHD. As a preliminary proof-of-concept, these findings require validation in the real-world, ecologically valid settings with larger and more diverse samples.
Keywords- ADHD; Attention Estimation; Passive Monitoring; Assistive Technology; Human-Computer Interaction; Machine Learning; Neurodivergence.
1. Introduction
For adults with Attention-Deficit/Hyperactivity Disorder (ADHD), everyday digital environments are full of potential distractions—constant notifications, endless browser tabs, and easy access to unrelated content [1], [2], [3]. Sustaining attention in this context is difficult, and the effects on study, work, and wellbeing can be substantial.
Despite the importance of attention in daily functioning, current tools for measuring it fall short, particularly outside of clinical or laboratory settings. Eye-tracking and EEG can provide precise, real-time data [4], but are expensive, intrusive, and impractical for long-term use [5]. In addition, eye tracking approaches can only identify attention on one device. Given how frequently internet users switch devices (e.g. looking something up on their phone while watching a lecture on their computer), an attention measurement system must consider what the user is interacting with across all their devices.
Self-report scales are more scalable but rely on memory and offer only coarse snapshots of experience [6]. It is akin to relying on occasional oral glucose tolerance tests to manage diabetes—accurate in determining a baseline but unhelpful for tracking everyday fluctuations. As a result, researchers, clinicians, and neurodivergent individuals often lack practical tools to monitor how attention changes throughout the day or in response to interventions. Table 1 summarizes the strengths and limitations of common attention measurement methods, highlighting how our approach addresses key gaps in ecological validity and goal alignment.
Table 1. Comparison of attention measurement methods
| Method | Real time? | Ecologically valid? | No additional hardware needed? | Minimally intrusive? | Scalable? |
| EEG | ✅ | ❌ | ❌ | ❌ | ❌ |
| Eye tracking | ✅ | ❌
(can’t detect if a person is doing something productive off screen) |
❌ | ❌ | ❌ |
| Self-report surveys | ❌ | ❌ | ✅ | ✅ | ✅ |
| App usage analysis | ✅ | ❌ (can’t detect whether the app usage aligns with user’s goals) | ✅ | ✅ | ✅ |
| Focus Bear computer usage + AI analysis | ✅ | ✅ | ✅ | ✅ | ✅ |
This study explores a more accessible and ecologically valid approach. By analyzing natural computer usage data, such as how often a person switches tabs, how long they are inactive, and whether their activity aligns with a declared focus goal, we aim to estimate attention in real time. Our goal is to enable continuous, high-resolution measurement of attention without the need for specialized hardware.
This data could allow individuals to monitor their attention patterns across days or weeks, helping them see whether strategies like medication, coaching, or behavioral interventions are having an impact. It could also help researchers and clinicians better understand the daily lived experience of ADHD, opening the door to more personalized and responsive care.
In this proof-of-concept study, we used data collected through Focus Bear [7] an assistive technology app designed to support attention and routine-building for neurodivergent users. The app passively tracks computer activity (e.g. tab switching, idle time, and focus goal alignment) to encourage more intentional work sessions. We trained a machine learning model to estimate moment-to-moment attention using these metrics, validated against labelled recordings of participants enacting real-world focus and distraction scenarios. This paper presents the methodology, results, and implications for both assistive technology and clinical research. As a proof-of-concept study with simulated data, the findings should be interpreted cautiously. While the modelling pipeline shows promise, its generalizability and real-world utility remain to be tested in ecologically valid environments with diverse participants.
2. Methodology
- Study Design
This was a proof-of-concept study designed to explore whether real-time attention could be estimated using everyday computer usage data. The aim was to validate the feasibility of a lightweight, accessible system for tracking attention without the need for specialized hardware.
- Participants
Six postgraduate data science students from RMIT University participated as part of a supervised capstone project. All were members of the research team and are co-authors on this study. Participants were aware of the study goals and intentionally enacted a range of attentional states, introducing a potential bias in behavior and labelling. While not representative of a clinical population, this sample was appropriate for validating system feasibility and refining the data labelling and modelling pipeline.
- Procedure
Each participant completed a 20–30-minute session in a controlled lab environment. Instead of working naturally, they were asked to enact a range of attentional scenarios designed to mimic real-life fluctuations in focus. These included periods of concentrated work on a specific goal (e.g. “revise assignment” or “write lab report”), as well as intentional distractions such as checking their phone while a document was open, taking handwritten notes away from the screen, browsing unrelated websites (e.g. reading the news instead of studying), and physically stepping away from the computer to simulate breaks (e.g. going to the toilet). This approach enabled the creation of a diverse dataset with clearly defined high- and low-attention states for model training.
Before each session, participants declared a focus goal in the Focus Bear app (e.g. “revise assignment” or “write report”). This helped contextualize whether their on-screen activity was aligned with their intended task.
During the session, we captured:
- Screen recordings using OBS Studio.
- Workstation recordings from a side-mounted webcam.
- Computer usage metrics from the Focus Bear app, including:
- Number of browser tabs open
- Average tab switching speed
- Idle time (in seconds)
Task relevance score – estimated using GPT-4.1, which was prompted to assess whether the active website (based on URL, tab title, and meta description) aligned with the participant’s declared focus goal.
Attention Scoring
Every three seconds, a frame from the screen and workstation recordings was extracted. These were labelled using GPT-4.1 Vision, which rated:
- Screen attention – based on whether the on-screen activity matched the declared focus goal
- Workstation attention – based on posture, presence, and signs of physical distraction (e.g. phone use)
Each score ranged from 0 (not attentive) to 1 (fully attentive).
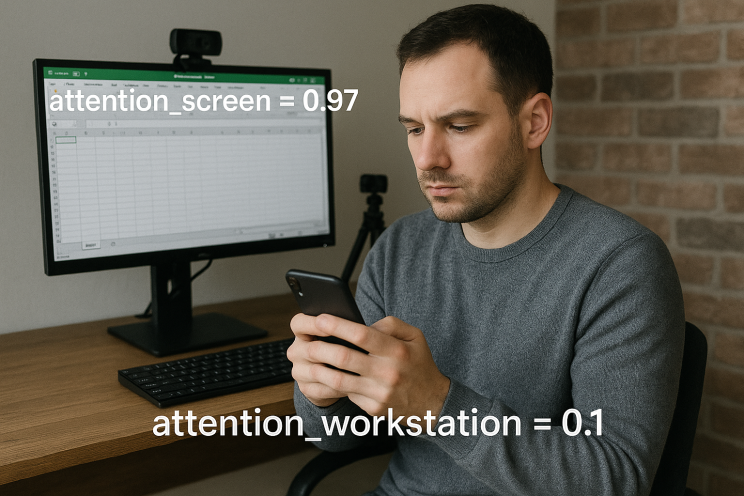 Figure 1: Screen-focused distraction with low workstation engagement.
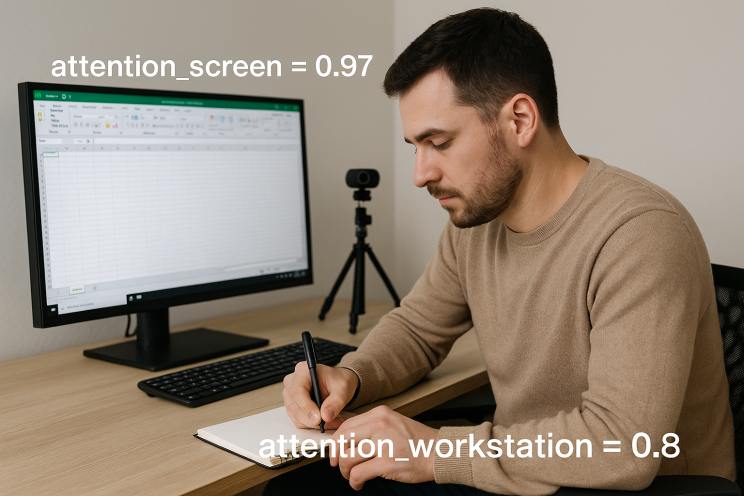 Figure 2: High attention to both screen and workstation during active task engagement.
The overall attention score was calculated as:
attention = screen_score × workstation_score
A random 10% of labelled frames were manually reviewed to ensure plausibility and internal consistency. While we did not formally assess inter-rater reliability, this manual check suggested a high face-validity of the GPT-based labelling approach. Given the exploratory nature of this study and the resource constraints, this method was deemed sufficient for early-stage prototyping.
All video recordings were deleted after frame extraction to preserve privacy.
Dataset and Model Training
The final dataset contained 1,340 three-second snapshots, each with:
- Input features: tab count, tab switching speed, idle time, and task relevance
- Target: an attention score derived from video-based labelling
Data were normalized and fed into a series of regression models, evaluated using 10-fold cross-validation. Models included:
- Linear Regression
- Random Forest
- Gradient Boosting
- Extra Trees Regressor
3. Results
The dataset contained 1,340 labelled snapshots across all participants. Each snapshot corresponded to a 3-second interval, paired with app-based metrics and an attention score derived from video frame analysis.
We evaluated four regression models using 10-fold cross-validation. The Extra Trees Regressor consistently outperformed the others, achieving a mean R² of 0.77, indicating a strong relationship between usage metrics and attention scores even in a small, synthetic sample.
Table 2 Performance Comparison of Regression Models for Predicting Attention Metrics
| Model | Best Parameters | R² Score | MAE | RMSE |
| Extra Trees | max_depth=20, min_samples_split=5, n_estimators=100 | 0.7997 | 0.0597 | 0.1236 |
| Random Forest | max_depth=10, min_samples_split=5, n_estimators=200 | 0.7826 | 0.0644 | 0.1281 |
| Gradient Boosting | learning_rate=0.1, max_depth=5, n_estimators=100 | 0.7769 | 0.0644 | 0.1293 |
| Decision Tree | max_depth=10, min_samples_split=2 | 0.7380 | 0.0634 | 0.1402 |
| SVR | C=10, gamma=’scale’ | 0.5478 | 0.1288 | 0.1857 |
| Polynomial Regression | poly_features__degree = 2 | 0.4850 | 0.1521 | 0.1985 |
| Linear Regression | — | 0.1809 | 0.2156 | 0.2504 |
Among the input features, the most informative were:
- Focus alignment score — higher semantic relevance to the declared goal strongly predicted higher attention.
- Idle time — prolonged inactivity correlated with reduced attentional engagement.
- Average tab duration — rapid tab switching often indicates reduced focus.
- Tab count — a higher number of open tabs had a weaker but still negative association with attention.
A sample of GPT-labelled frames (10%) was manually reviewed and showed high agreement with human interpretation, supporting the validity of the labelling approach.
4. Discussion
4.1. Summary of Findings
This study explored whether everyday computer usage data could be used to estimate attention in real time. The results show that even with a small, simulated dataset, machine learning models—particularly tree-based methods—can reliably predict attention levels using non-intrusive, passively collected features. The high R² value (0.77) indicates strong potential for this approach, especially considering its low cost and minimal user burden.
4.2. Model performance
Tree-based ensemble models (Extra Trees, Random Forest, Gradient Boosting) substantially outperformed linear and kernel-based models. This suggests that attention, as inferred from passive usage data, involves non-linear interactions and hierarchical feature dependencies. For instance, tab switching may only signal distraction when focus alignment is also low — a relationship linear models struggled to capture.
The best-performing model, Extra Trees Regressor, achieved the highest R² and lowest error rates, likely due to its ability to handle collinearity, complex feature interactions, and noisy labels. Interestingly, it outperformed XGBoost despite both being ensemble methods and despite careful hyperparameter tuning for each. We suspect this is due to Extra Trees’ robustness to label noise and its greater feature randomness, which helps prevent overfitting in smaller, noisier datasets. In contrast, XGBoost’s sequential boosting structure may have been more sensitive to inconsistencies in the AI-derived attention scores.
SVR and Polynomial Regression underperformed due to their limited capacity to model non-linear relationships and tendency to overfit or underfit small, high-variance samples.
These outcomes are likely influenced by the modest dataset size (~1,300 samples) and may change with larger, more diverse training data. In future work, we expect boosting methods to improve in relative performance as the signal-to-noise ratio increases and residual errors become more informative.
4.3. Implications for ADHD and Accessibility
Adults with ADHD often struggle with attention regulation in digital environments, and existing measurement tools (e.g., clinical interviews, self-report, lab tests) are often impractical for day-to-day use. Our system offers a more inclusive, ecological alternative: a way to monitor focus using data most users already generate while working.
From an accessibility perspective, this approach aligns with the principles of universal design. It requires no specialized equipment or user intervention, making it well-suited for neurodivergent users who may find other attention-tracking tools intrusive, fatiguing, or unreliable.
This kind of passive, high-resolution attention tracking could eventually be used to:
- Evaluate the day-to-day effectiveness of ADHD interventions
- Identify optimal working periods based on chronotype and cognitive load
- Detect attention decline due to fatigue, illness, or environmental stressors
- Provide real-time feedback to help users manage distraction
4.4. Limitations
As proof of concept, this study was limited in several important ways:
- All participants were members of the research team simulating attentional states
- Sessions were short (~25 minutes) and not representative of real-world focus sessions
- No participants with diagnosed ADHD were involved at this stage
- Attention labels were derived from GPT-4.1 classification, which, while efficient, may introduce occasional misclassifications
- The attentional metrics only included data from Mac computers. Future versions should work on mobile phones as well to holistically capture device usage.
4.5. Next Steps: Ecological Validation in a Clinical Sample
The next phase of this research will involve ecological validation with a broader participant group, including adults with and without ADHD. This study will:
- Recruit N=100 university students aged 18–30
- Use ADHD screening tools (ASRS) to compare attention profiles
- Ask participants to use the Focus Bear app for 4 weeks, during which usage metrics and model-predicted attention scores will be passively collected across their computer and phone
- Collect covariates such as sleep hours, medication use, study load, and tech literacy
- Examine how estimated attention fluctuates day to day, and whether average attention scores or variability differ between ADHD and neurotypical groups
This larger study will allow us to test generalizability, assess sensitivity to intervention effects (e.g. medication use), and evaluate how usable and acceptable the tool is for end users.
5. Conclusion
This proof-of-concept study demonstrates that real-time attention estimation is possible using passive computer usage data—without relying on invasive tools or self-report. By modelling features such as tab behavior, idle time, and task relevance, we achieved strong predictive performance in detecting shifts in attentional engagement.
For adults with ADHD, this represents a meaningful step toward more accessible, personalized tools for monitoring focus and supporting productivity. The approach aligns with inclusive design principles, offering a way to adapt to users’ natural workflows rather than requiring behavior change.
Building on this foundation, the next phase will involve validating the model in a larger, ecologically valid study with university students, including those with ADHD. This will allow us to assess generalizability, track day-to-day fluctuations in focus, and explore whether this technology can meaningfully inform intervention and support strategies.
In doing so, we hope to contribute a scalable, neurodivergent-friendly alternative to traditional attention assessment—one that works not just in labs, but in life.
Conflict of Interest
Jeremy Nagel is the founder of Focus Bear; the software tool used in this study. All other authors declare no competing interests.
References
[1] G. Mark, S. Iqbal, and M. Czerwinski, “How blocking distractions affects workplace focus and productivity,” in Proceedings of the 2017 ACM International Joint Conference on Pervasive and Ubiquitous Computing and Proceedings of the 2017 ACM International Symposium on Wearable Computers, in UbiComp ’17. New York, NY, USA: Association for Computing Machinery, Sep. 2017, pp. 928–934. doi: 10.1145/3123024.3124558.
[2] C. E. Sihoe, U. Mueller, and S. Liu, “Perceived smartphone addiction predicts ADHD symptomatology in middle school adolescents: A longitudinal study,” Comput. Hum. Behav. Rep., vol. 12, p. 100335, Dec. 2023, doi: 10.1016/j.chbr.2023.100335.
[3] S. Kocyigit, H. S. Guzel, B. Acikel, and M. Cetinkaya, “Comparison of Smartphone Addiction Level, Temperament and Character and Parental Attitudes of Adolescents with and without Attention Deficit Hyperactivity Disorder,” Int. J. Ment. Health Addict., vol. 19, no. 4, pp. 1372–1384, Aug. 2021, doi: 10.1007/s11469-021-00494-2.
[4] V. Levantini et al., “EYES Are The Window to the Mind: Eye-Tracking Technology as a Novel Approach to Study Clinical Characteristics of ADHD,” Psychiatry Res., vol. 290, p. 113135, Aug. 2020, doi: 10.1016/j.psychres.2020.113135.
[5] N. V. Valtakari, I. T. C. Hooge, C. Viktorsson, P. Nyström, T. Falck-Ytter, and R. S. Hessels, “Eye tracking in human interaction: Possibilities and limitations,” Behav. Res. Methods, vol. 53, no. 4, pp. 1592–1608, Aug. 2021, doi: 10.3758/s13428-020-01517-x.
[6] J. A. Suhr, C. Cook, and B. Morgan, “Assessing Functional Impairment in ADHD: Concerns for Validity of Self-Report,” Psychol. Inj. Law, vol. 10, no. 2, pp. 151–160, Jun. 2017, doi: 10.1007/s12207-017-9292-8.
[7] “Focus Bear | Productivity and routine app for AuDHDers” Accessed: Jun. 29, 2025. [Online]. Available: https://www.focusbear.io