Early Detection of Autism Spectrum Disorder (ASD) in Children using Machine Learning
Research article  Open access |
Available online on: 27 April, 2025 |
Last update: 27 April, 2025
Open access |
Available online on: 27 April, 2025 |
Last update: 27 April, 2025
Abstract
Autism Spectrum Disorder (ASD) is a complex neurodevelopmental condition that affects communication, social interaction, and behavior, necessitating early diagnosis for effective intervention. This study aims to improve the accuracy and efficiency of ASD screening for toddlers through the application of machine learning models utilizing the Q-CHAT-10 dataset. Following the CRISP-DM methodology, we conducted comprehensive data preparation, feature selection, and model evaluation. We compared the performance of three machine learning models: Logistic Regression, Decision Tree, and Artificial Neural Network (ANN). The ANN exhibited the highest performance, achieving an accuracy of 98.5% and an F1-Score of 98.5%, followed closely by the Decision Tree model with an accuracy of 98.23%. Logistic Regression, although less precise, maintained a reliable performance with an F1-Score of 91.02%. This research highlights the potential of AI-driven pre-diagnostic tools to expedite ASD screening processes, significantly reducing waiting times for assessments. Future work will focus on integrating clinical datasets and exploring multi-modal data, including eye-tracking and behavioral video analysis, to further enhance diagnostic accuracy and support early intervention strategies in real-world settings.
Keywords- Autism Spectrum Disorder; Machine Learning; Artificial Intelligence; Decision Tree; Random Forest; Logistic Regression.
Introduction
Autism Spectrum Disorder (ASD) is a neurodevelopmental condition that influences how individuals perceive their environment and interact socially. It is marked by difficulties in communication, social interactions, and repetitive patterns of behavior [1]. Although prevalence rates vary across studies and regions, approximately 1 in 100 individuals globally are believed to be affected by ASD [2]. While the exact causes remain unclear, research points to a combination of genetic and environmental factors playing a role in its onset [3].
Between 1998 and 2018, ASD diagnoses in the UK rose dramatically, particularly among adults and females. However, there has been little progress in increasing early diagnoses during childhood, despite efforts to identify cases before the age of three [4]. Early identification of ASD is critical, as studies show that interventions are most effective when introduced before a child turns eight [5]. Intensive behavioral therapy in early childhood has been proven to significantly enhance cognitive abilities, language development, and social skills in preschool-aged children with [6]. In the UK, the waiting time for an initial assessment of ASD can be as long as 14 months [1]. As of December 2022, approximately 140,000 individuals were waiting for appointments. Obtaining a diagnosis is essential for children to receive the necessary support and resources. For example, an ASD diagnosis can help families better understand their child’s specific needs and ensure access to tailored educational support, such as Individual Education Plans (IEPs) and additional assistance in schools [7]. Given the complex and diverse nature of ASD, diagnosis often requires a collaborative approach involving multiple disciplines. For children, the process may include interviews with parents, observations of behavior, cognitive tests, and medical evaluations [8]. However, the unclear origins of ASD and the lengthy diagnostic procedures make accurate and timely diagnosis challenging. Current methods often involve prolonged observation and comprehensive evaluations across various domains [9]. Common diagnostic tools include the Autism Diagnostic Interview-Revised (ADI-R) and the Autism Diagnostic Observation Schedule (ADOS) [10]. The ADI-R relies on semi-structured interviews with caregivers or parents [11], while the ADOS assesses behaviors through age-specific, semi-structured play activities [12]. To help reduce the waiting times for clinical ASD assessments and facilitate earlier diagnoses for children, pre-diagnostic screening tools are frequently utilized to support referral processes. These tools usually involve standardized questionnaires that can be completed by parents or caregivers for children, or self-administered by adults [13]. Enhancing the diagnostic process is essential for ensuring individuals with ASD receive early intervention and the necessary support. Streamlined assessments could significantly improve developmental outcomes for those on the autism spectrum.
Materials and Methods
The CRISP-DM (Cross-Industry Standard Process for Data Mining) methodology is
employed in this paper to evaluate the accuracy of early detection of ASD using
different machine learning techniques.
![Phases of CRISP-DM [14]](https://cdn.nafath.mada.org.qa/data/wp-content/uploads/2025/04/28_3_1.png)
Figure 1. Phases of CRISP-DM [14]
- Data Understanding
The data has been taken from Kaggle it is called as ‘Autistic Spectrum Disorder Screening Data for Toddlers’. They introduce a novel dataset focused on autism screening for toddlers, which includes key features that can be leveraged for advanced analysis, particularly in identifying autistic traits and enhancing the classification of ASD cases. This dataset captures ten behavioral indicators (Q-Chat-10) along with additional individual characteristics that have been demonstrated to effectively differentiate ASD cases from controls in behavioral science studies. The dataset is predictive and descriptive in nature, containing nominal/categorical, binary, and continuous data types, making it suitable for classification tasks, as well as clustering, association analysis, or feature assessment. It falls under the domain of medical, health, and social sciences and consists of 1,054 instances with 18 attributes, including the class variable, and contains no missing values. The attributes include ten behavioral items from the Q-Chat-10 questionnaire (A1-A10), where responses were mapped to binary values (“1” or “0”). For questions A1 to A9, responses of “Sometimes,” “Rarely,” or “Never” were assigned a value of “1,” while for question A10, responses of “Always,” “Usually,” or “Sometimes” were assigned “1.” If the total score across all ten questions exceeded 3, the individual was flagged as potentially exhibiting ASD traits; otherwise, no ASD traits were identified. Additional features in the dataset were collected through the “submit” screen of the ASDTests screening app, with the class variable automatically assigned based on the user’s score during the screening process. [15].
- Explanatory Data Analysis
Exploratory Data Analysis (EDA) was performed on the dataset to explore the key attributes and patterns associated with Autism Spectrum Disorder (ASD) in toddlers. The findings suggest that approximately 69.1% of toddlers worldwide are affected by ASD. The highest number of ASD cases are observed among White Europeans, followed by Asians, while Native Indian and Pacifica ethnic groups show a higher susceptibility to ASD. Males are more likely to be diagnosed with ASD compared to females. Additionally, toddlers who have had jaundice are more likely to be diagnosed with ASD than those without jaundice. Interestingly, the majority of children with ASD do not have family members with the condition, indicating that ASD may not be predominantly hereditary. The tests for most ASD cases are completed by family members, and toddlers around the age of 36 months exhibit the highest number of ASD diagnoses. The likelihood of ASD is greatest at 2 years of age, and toddlers with a Q-Chat-10 score above 3 are more likely to be diagnosed with ASD. Furthermore, most toddlers with autism do not react emotionally when their loved ones are upset, highlighting a common lack of emotional response among these children. To visualize these findings, several graphs and charts were created to better illustrate these trends and insights.
- Data Preparation
In the Toddler dataset, there were no missing values for the selected features, allowing all 1,054 samples to be used in training. However, both the Child-Adolescent and Adult datasets contained missing values, which were represented by ‘?’ or values falling outside of the expected range. In the Child-Adolescent dataset, 4 records were excluded due to missing age values, while an additional 46 records were removed because the ‘Relation,’ ‘Ethnicity,’ and ‘Country_of_Res’ fields were all marked with ‘?’—indicating either incomplete data or potential errors in form completion. Although these fields were not included in the model, the significant gaps in data suggested these records might be invalid. In the Adult dataset, 2 records were removed due to missing age values, and 1 record with an age of ‘383’ was excluded as an outlier. Furthermore, 93 records were removed because of incomplete ‘Relation,’ ‘Ethnicity,’ and ‘Country_of_Res’ fields, which raised concerns about the validity of the data. The Child-Adolescent dataset consisted of 346 records, while the Adult dataset had 608 records. To standardize the data, the age attribute was normalized using a MinMaxScaler, scaling the value between 0 and 1. Since all other features were binary, this normalization prevented the age value from distorting the model. The models were evaluated both with and without this normalization step to assess its impact on performance.
- Feature Selection
The initial dataset included 18 variables, with 15 selected for model training. The variable “Who completed the test” was excluded as it was irrelevant to the outcome. Following [15] recommendation, the “QCHAT-10 score” was also removed since it was used to assign the class label, which could lead to overfitting. Additionally, the “Ethnicity” variable was omitted due to its imbalance in the dataset, which could introduce unintended biases. The remaining features selected for training included all 10 Q-CHAT items, along with “Age,” “Sex,” “Jaundice,” and “Family member with ASD.” The target variable was the “Class” variable. To prepare the data for training, the “Sex,” “Jaundice,” “Family member with ASD,” and “Class” variables were encoded into binary integers using the Label Encoder function. For the Child, Adolescent, and Adult datasets, which were similarly structured with 20 features, 13 were selected for training. As in the Toddler dataset, the features “Ethnicity,” “Country of Residence,” and “Relation” were removed. The “Age description” feature was excluded since it was identical across datasets (e.g., “4-11 years” in the Child dataset). The “result” and “autism” features were also discarded, as they were used to generate the “Class” variable. The “Sex,” “Jaundice,” and “Class” variables were converted to binary integers using the Label Encoder for consistency in model training.
- Modelling
For predicting accuracy on ASD dataset, three models were applied: Logistic Regression, Decision Tree (DT) and Artificial neural network (ANN). The system was implemented on Google Colab, 5 a cloud-based Jupyter notebook environment offering access to computational resources, including GPUsColab also facilitates easy collaboration, making it useful for research projects.
- Evaluation
Evaluating the model is a critical phase in AI-based learning, focusing on assessing how well the trained models perform. This step ensures that the model generalizes effectively to new data and guides decisions on deployment and further improvements. The following metrics and techniques contribute to a comprehensive evaluation:
Accuracy measures the overall performance of the model by showing how often it correctly classifies or predicts outcomes.
Accuracy = TP + TN / TP + TN + FP + FN
Precision measures the accuracy of positive predictions, with higher precision indicating more correct positive classifications.
Precision = TP/ TP + FP
Recall assesses the model ‘s ability to detect true positive cases. A higher recall means the model effectively identifies actual positive instances.
Recall = TP/ TP + FN
The F1-score combines precision and recall into a single metric by calculating their harmonic mean, offering a balanced evaluation of both.
F1- Score = (2 × precision × recall) / (precision + recall)
Results and Discussion
- Logistic Regression
his implementation evaluates a Logistic Regression model using pre-scaled training and testing data. The Logistic Regression model is configured with max_iter=1000 to ensure convergence during optimization, and a random_state=42 for reproducibility. The model is trained on the scaled training data, and predictions are made on the test set. The performance of the model is assessed using key metrics, including accuracy, precision, recall, and F1-score. These metrics are structured into a DataFrame for comparison with other models. Additionally, the model’s learning behavior is analyzed using a learning curve. The learning_curve function from scikit-learn computes training and validation accuracies for different training set sizes using cross-validation. The model achieved an accuracy of 90.4%, with a precision of 91.49%, a recall score of 90.56%, and an F1-score of 91.02%.
- Artificial Neural Networks
The Artificial Neural Network (ANN) model implemented in this code is designed for binary classification, with a structure consisting of an input layer, one hidden layer, and an output layer. The input layer has 64 neurons, and the hidden layer uses the ReLU activation function to introduce non-linearity. The output layer uses a Sigmoid activation function to predict probabilities for binary outcomes. The model is compiled using the Adam optimizer and the binary cross entropy loss function, with accuracy as the evaluation metric. To prevent overfitting, the EarlyStopping callback is utilized, monitoring the validation loss and stopping training early if the model’s performance plateaus over 10 epochs. The training process uses a batch size of 20, a maximum of 100 epochs, and a validation split of 20% to assess the model’s generalization on unseen data. The model achieved an accuracy of 98.5%, with a precision of 98.72%, a recall score of 98.46%, and an F1-score of 98.5%.
- Decision Tree
This implementation evaluates a Decision Tree Classifier using pre-scaled training and testing data. The Decision Tree model is optimized with specific hyperparameters such as criterion=’entropy’, min_samples_split=10, and min_samples_leaf=5 to improve generalization and mitigate overfitting. After training, predictions are made on the test data, and the model’s performance is assessed using metrics like accuracy, precision, recall, and F1-score. These metrics are structured into a DataFrame for comparison with other models. Additionally, a learning curve analysis is performed to visualize the model’s learning behavior. Using the learning_curve function from scikit-learn, training and validation accuracies are computed for varying training set sizes. The mean and standard deviations across cross-validation folds are plotted to analyze how the model generalizes as more data is introduced. The model achieved an accuracy of 98.23%, with a precision of 97%, a recall score of 99 %, and an F1-score of 98%.
- Comparative Results
Table 1. Models Results
| Model | Accuracy | Precision | Recall | F1-Score |
| Decision Tree | 98.23% | 97% | 99% | 98% |
| ANN | 98.5% | 98.72% | 98.46% | 98.5% |
| Logistic Regression
|
90.4% | 91.49% | 90.56% | 91.02% |
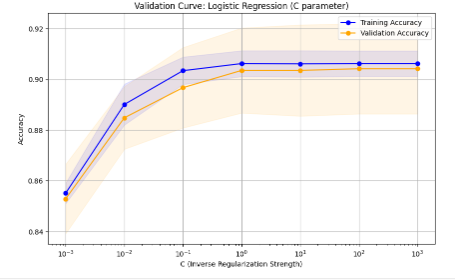
Figure 2. Logistic Regression Validation Curve
The graph represents a validation curve for Logistic Regression, illustrating the effect of the C parameter (inverse regularization strength) on model accuracy for both training and validation datasets. On the x-axis, smaller values of C indicate stronger regularization, which simplifies the model, while larger values reduce regularization, allowing the model to capture more complex patterns. At low C values, both training and validation accuracy are low due to under fitting, as excessive regularization prevents the model from learning effectively. As C increases to a moderate range, the model achieves a balance, with both training and validation accuracy improving and converging, indicating proper generalization. However, at very high C values, training accuracy continues to rise, but validation accuracy plateaus or slightly decreases, suggesting overfitting, where the model captures noise in the training data and fails to generalize. The shaded areas represent variability across cross-validation folds. The graph shows that the optimal C value lies in the mid-range, where the model achieves high and balanced accuracy on both datasets.
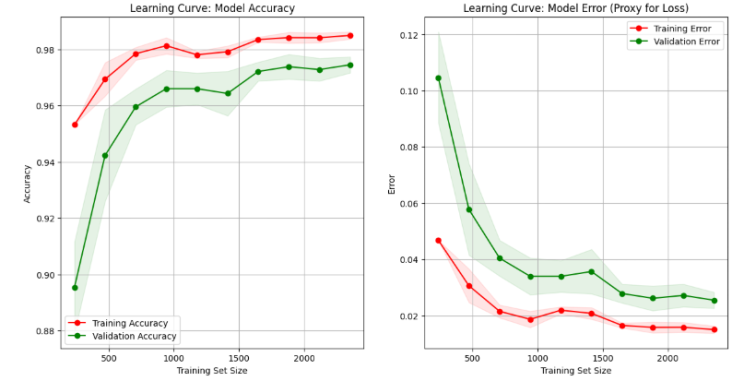
Figure 3. Decision Tree Learning Curve
The learning curves illustrate how the model’s accuracy and error evolve as the training dataset size increases. In the accuracy graph, the training accuracy starts very high when the dataset is small because the model memorizes the data. However, validation accuracy is much lower at this stage due to poor generalization. As more data is added, training accuracy slightly decreases while validation accuracy steadily improves, with both curves converging and stabilizing as the training set grows, indicating a well-generalized model. In the error graph, the opposite trend is observed: training error is initially very low for small datasets but increases as the model transitions from memorizing to generalizing. Validation error starts high but decreases significantly as the dataset grows, eventually converging with training error at a low level. This demonstrates that the model performs well on both seen and unseen data, achieving a good balance between bias and variance.
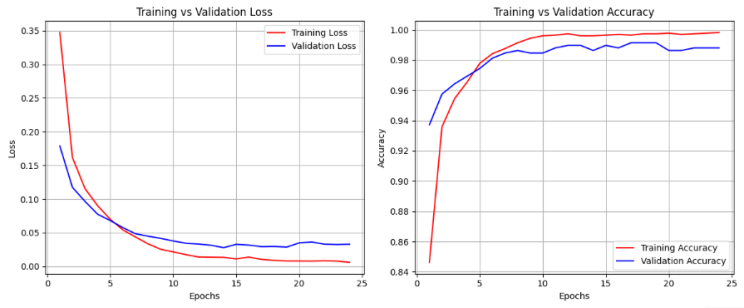
Figure 4. ANN Validation Curve
The graphs illustrate the learning behavior of an Artificial Neural Network (ANN) model over 25 epochs. The left plot shows the training and validation loss, where both curves steadily decrease during the early epochs as the model learns. The training loss (red) drops quickly, and the validation loss (blue) follows a similar trend, eventually stabilizing at a low value. This indicates that the model is not overfitting or under fitting, achieving good generalization. The right plot depicts training and validation accuracy. The training accuracy (red) rises rapidly, approaching 100%, while the validation accuracy (blue) also increases and stabilizes slightly lower than the training accuracy. The small gap between the two curves suggests the model generalizes well to unseen data without overfitting.
Conclusion and Future Scope
The primary goal of this project was to leverage AI to create an accessible and transparent approach to ASD screening, aiming to help reduce the waiting times for a diagnosis. The applied machine learning methods showed a good performance to early detect the ADS. The Artificial Neural Network (ANN) achieved the highest overall performance, with an F1-Score of 98.5%, while the Decision Tree model also showed excellent results. The Logistic Regression model, though less effective than the other two, still performed reliably with an F1-Score of 91.02%. The next steps should focus on training the models with a multi-modal dataset, integrating clinical classifications, and collaborating with healthcare professionals for further refinement. To improve accuracy, future research should focus on developing a dataset based on individuals who have undergone clinical assessments and been diagnosed accordingly. Additionally, combining different types of data, such as videos and eye-tracking information, could further enhance the model’s precision. A potential improvement would be to develop models that incorporate multi-modal data, which could enhance objectivity and minimize the biases that are often seen in ASD screening and diagnosis.
References
National Autistic Society (2023) Advice and Guidance: What is Autism? Available at: https://autism.org.uk [Accessed 28/11/2024]
Zeidan, J., Fombonne, E., Scorah, J., Ibrahim, A., Durkin, M. S., Saxena, S., … & Elsabbagh, M. (2022). Global prevalence of autism: A systematic review update. Autism research, 15(5), 778-790.
Spilsbury, R. (2018). Autism. The Rosen Publishing Group, Inc.
Russell, G., Stapley, S., Newlove‐Delgado, T., Salmon, A., White, R., Warren, F., … & Ford, T. (2022). Time trends in autism diagnosis over 20 years: a UK population‐based cohort study. Journal of Child Psychology and Psychiatry, 63(6), 674-682.
Baraka, K., Melo, F. S., & Veloso, M. (2017). Simulating behaviors of children with autism spectrum disorders through reversal of the autism diagnosis process. In Progress in Artificial Intelligence: 18th EPIA Conference on Artificial Intelligence, EPIA 2017, Porto, Portugal, September 5-8, 2017, Proceedings 18 (pp. 753-765). Springer International Publishing.
Remington, B., Hastings, R. P., Kovshoff, H., degli Espinosa, F., Jahr, E., Brown, T., … & Ward, N. (2007). Early intensive behavioral intervention: Outcomes for children with autism and their parents after two years. American Journal on Mental Retardation, 112(6), 418-438.
NHS (2023) Advice About School If Your Child is Autistic. Available at: https://www.nhs.uk/conditions/autism/autism-and-everyday-life/school/ [Accessed 28/11/24]
Lai, M. C., Lombardo, M. V., & Baron-Cohen, S. (2014). Search strategy and selection criteria. Lancet, 383, 896-910.
Thabtah, F., & Peebles, D. (2019). Early autism screening: a comprehensive review. International journal of environmental research and public health, 16(18), 3502.
Evans, P., Golla, S., & Morris, M. A. (2015). Autism spectrum disorders: Clinical considerations. In Rosenberg’s Molecular and Genetic Basis of Neurological and Psychiatric Disease (pp. 197-207). Academic Press.
Sophy Kim, S. H., Bal, V. H., & Lord, C. (2021). Autism Diagnostic Interview-Revised. In Encyclopedia of Autism Spectrum Disorders (pp. 470-475). Cham: Springer International Publishing.
Maddox, B. B. (2021). Accuracy of the ADOS-2 in Identifying Autism Among Adults with Complex Psychiatric Conditions, The. In Encyclopedia of Autism Spectrum Disorders (pp. 42-43). Cham: Springer International Publishing.
Elder, J. H., Kreider, C. M., Brasher, S. N., & Ansell, M. (2017). Clinical impact of early diagnosis of autism on the prognosis and parent–child relationships. Psychology research and behavior management, 283-292.
Wirth, R., & Hipp, J. (2000, April). CRISP-DM: Towards a standard process model for data mining. In Proceedings of the 4th international conference on the practical applications of knowledge discovery and data mining (Vol. 1, pp. 29-39).
Thabtah, F. (2017, May). Autism spectrum disorder screening: machine learning adaptation and DSM-5 fulfillment. In Proceedings of the 1st International Conference on Medical and health Informatics 2017 (pp. 1-6).